Mood patterns and stress triggers were difficult to understand from inconsistent check-ins.
Contribution
Designed the UX concept, information hierarchy, filters, trends, and supportive alert patterns.
Delivery
Academic UX concept and high-fidelity prototype.
Evidence
Research goals, interaction model, key screens, and Figma source.
Outcome
Clarity and supportive guidance are intended outcomes; no clinical or production result is claimed.
01 / Case study
The Problem
People often track mood inconsistently and struggle to understand what causes stress over time. The challenge was turning daily check-ins into meaningful insight without overwhelming users.
Mood trends are hard to see
Stress triggers remain unclear
Typical insight views feel too complex
02 / Case study
Research & Goals
The focus was clarity rather than complexity.
Make patterns visible
Users should notice good and difficult weeks without digging.
Natural filters
Day, week, and month toggles should reduce noise.
Support, not overwhelm
Alerts should be gentle and actionable, suggesting coping steps rather than warning users.
03 / Case study
The Solution
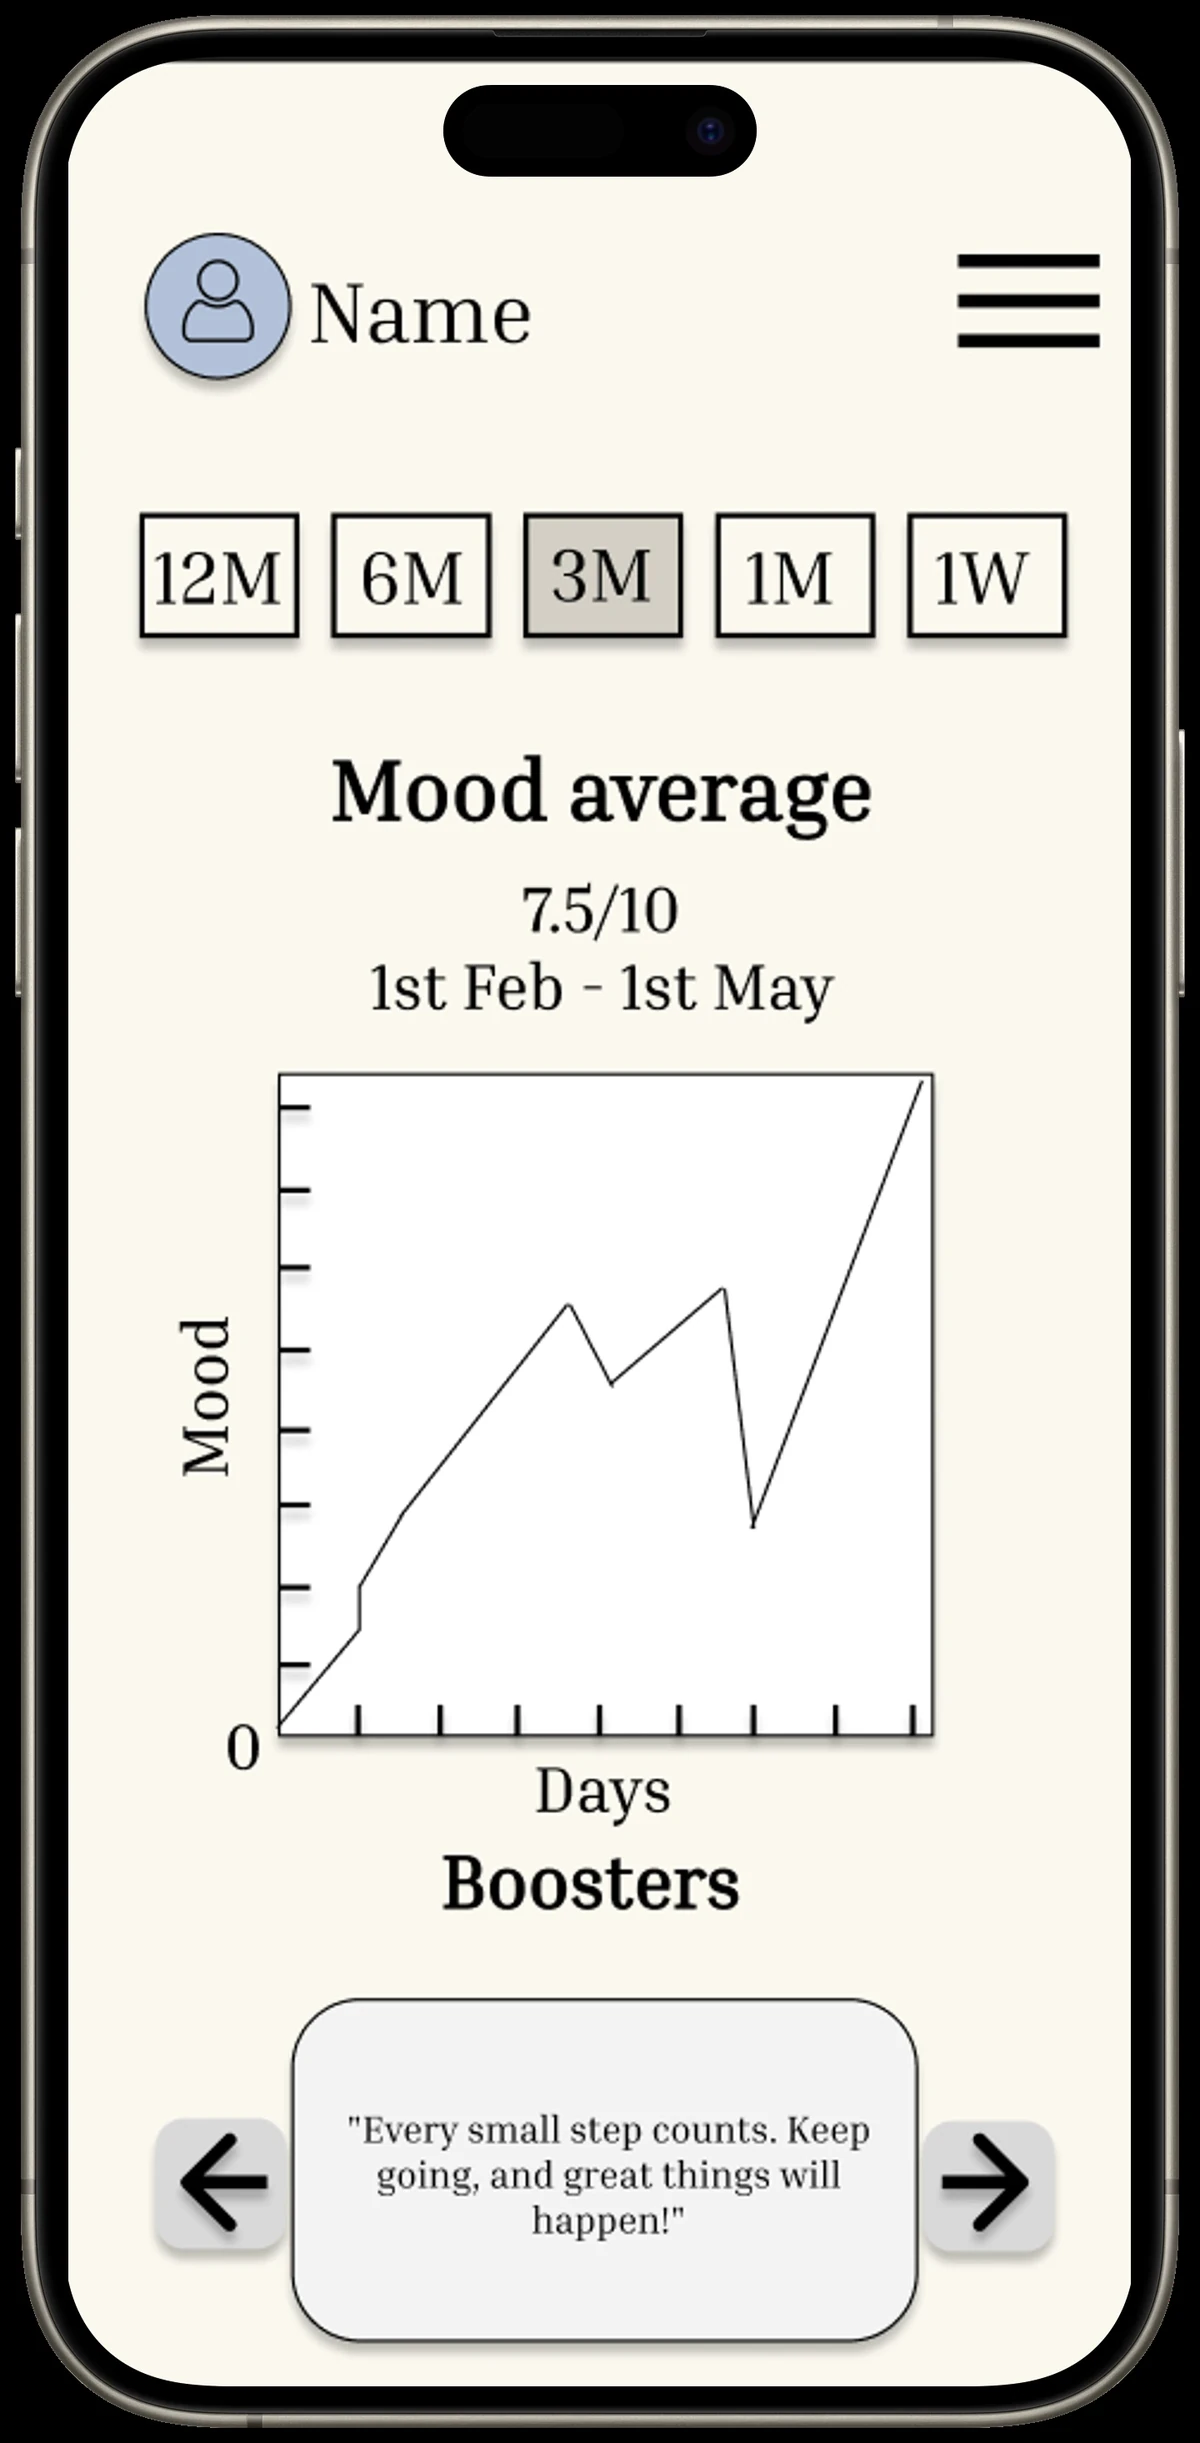
A clean Insights dashboard pairs understandable mood trends with stress patterns and supportive nudges.
Mood trend graph
Spot changes across day, week, and month.
Filters
Switch time ranges with one tap.
Stress alerts
Provide supportive prompts based on recurring patterns.
04 / Case study
Key Screens
The UI prioritizes readable charts, obvious filters, and personal-feeling insights.
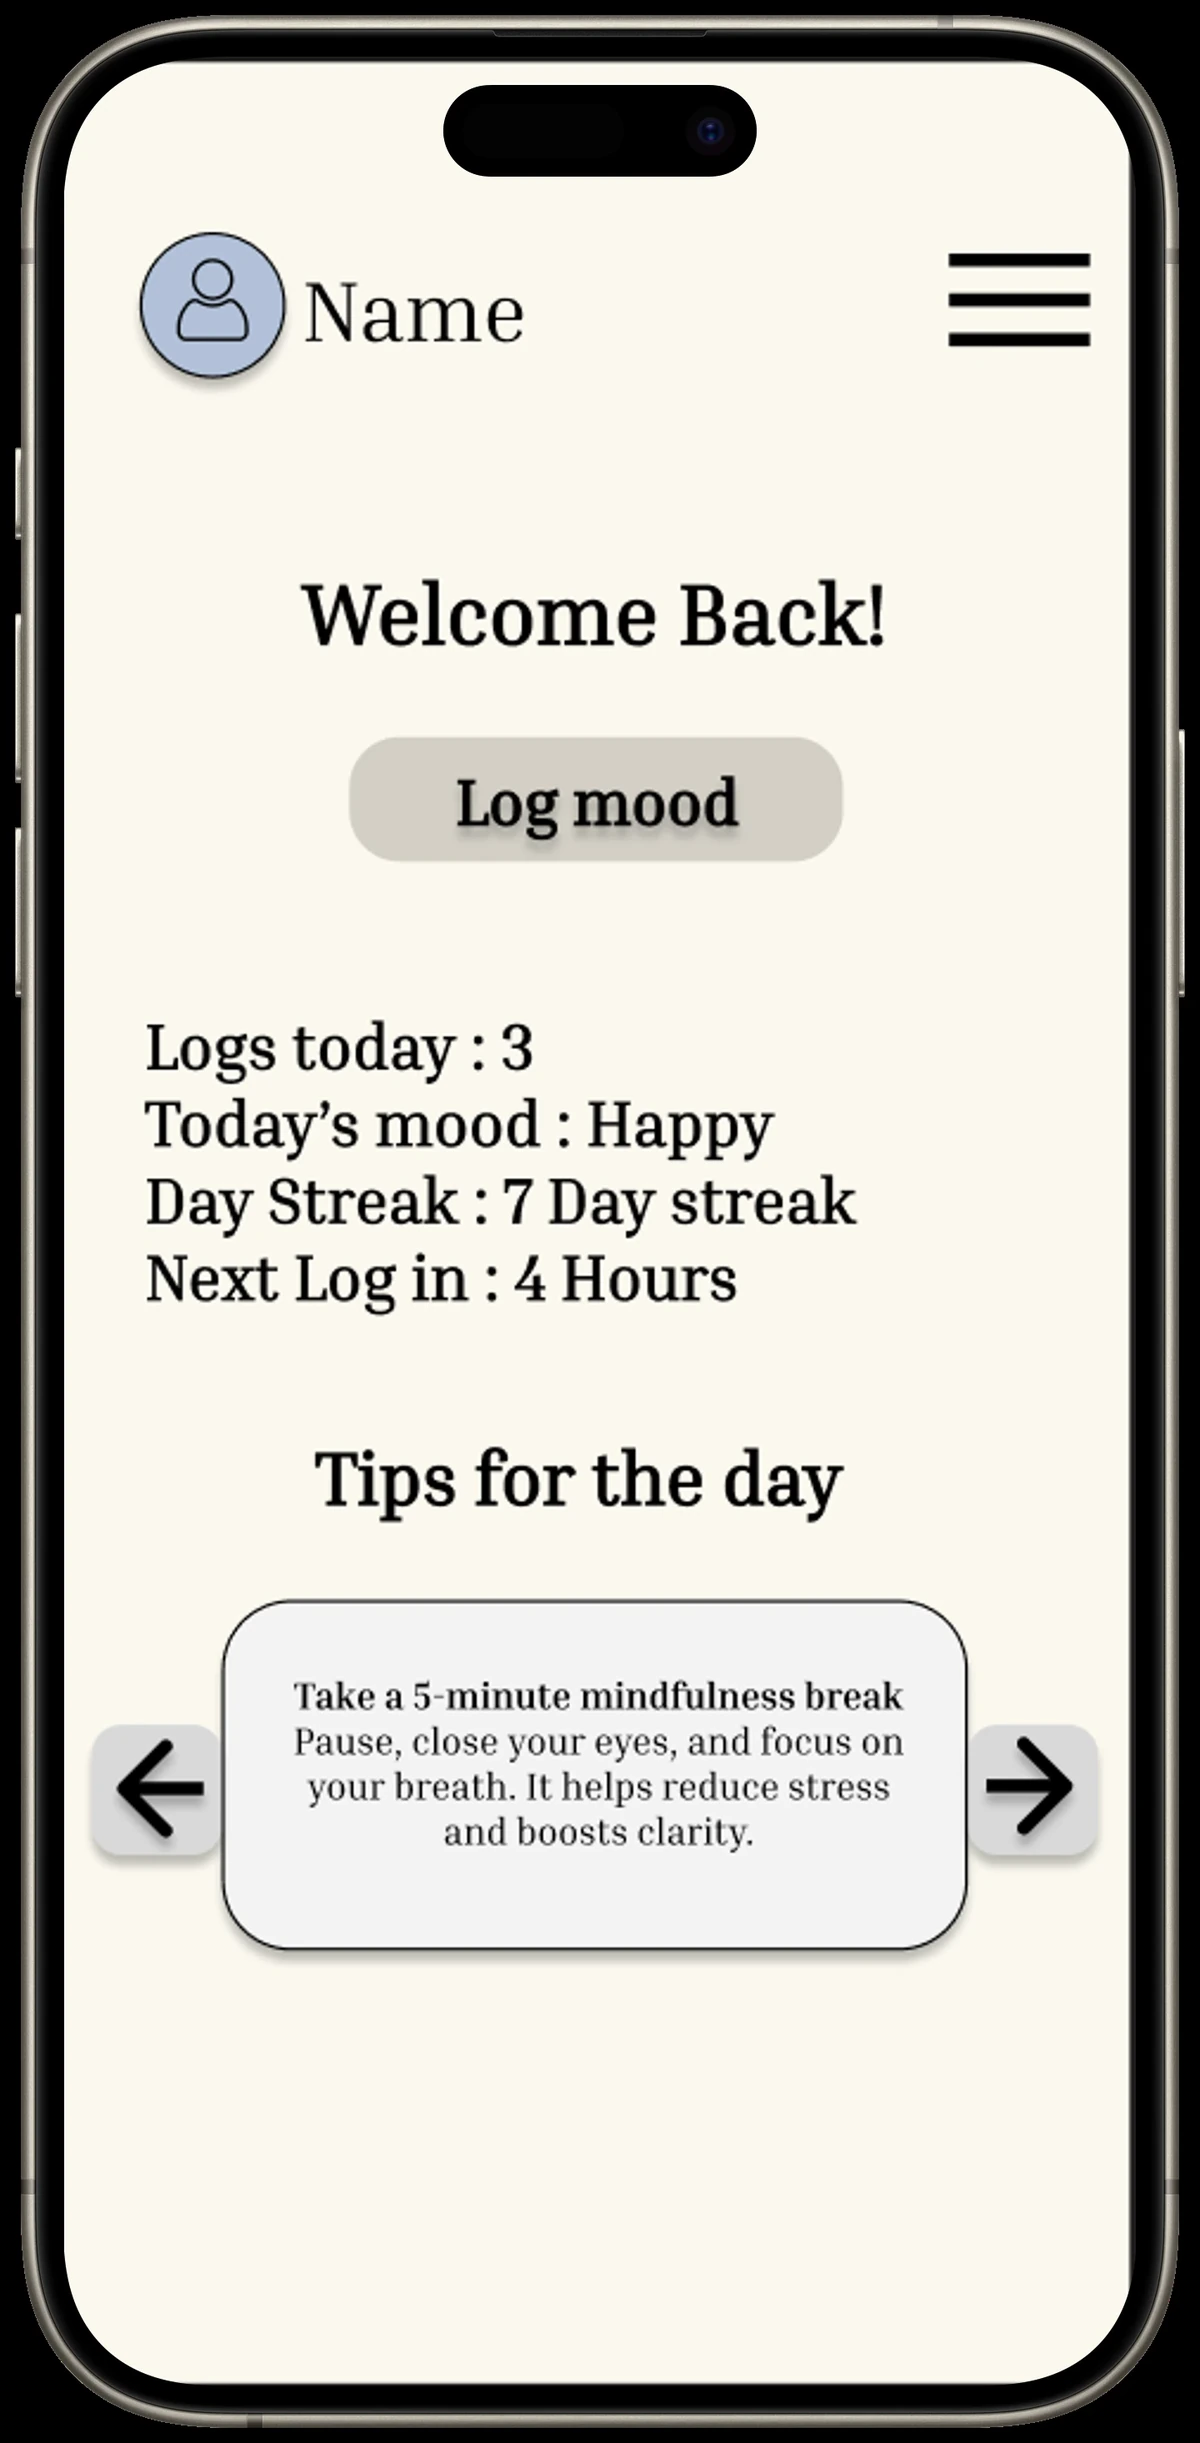
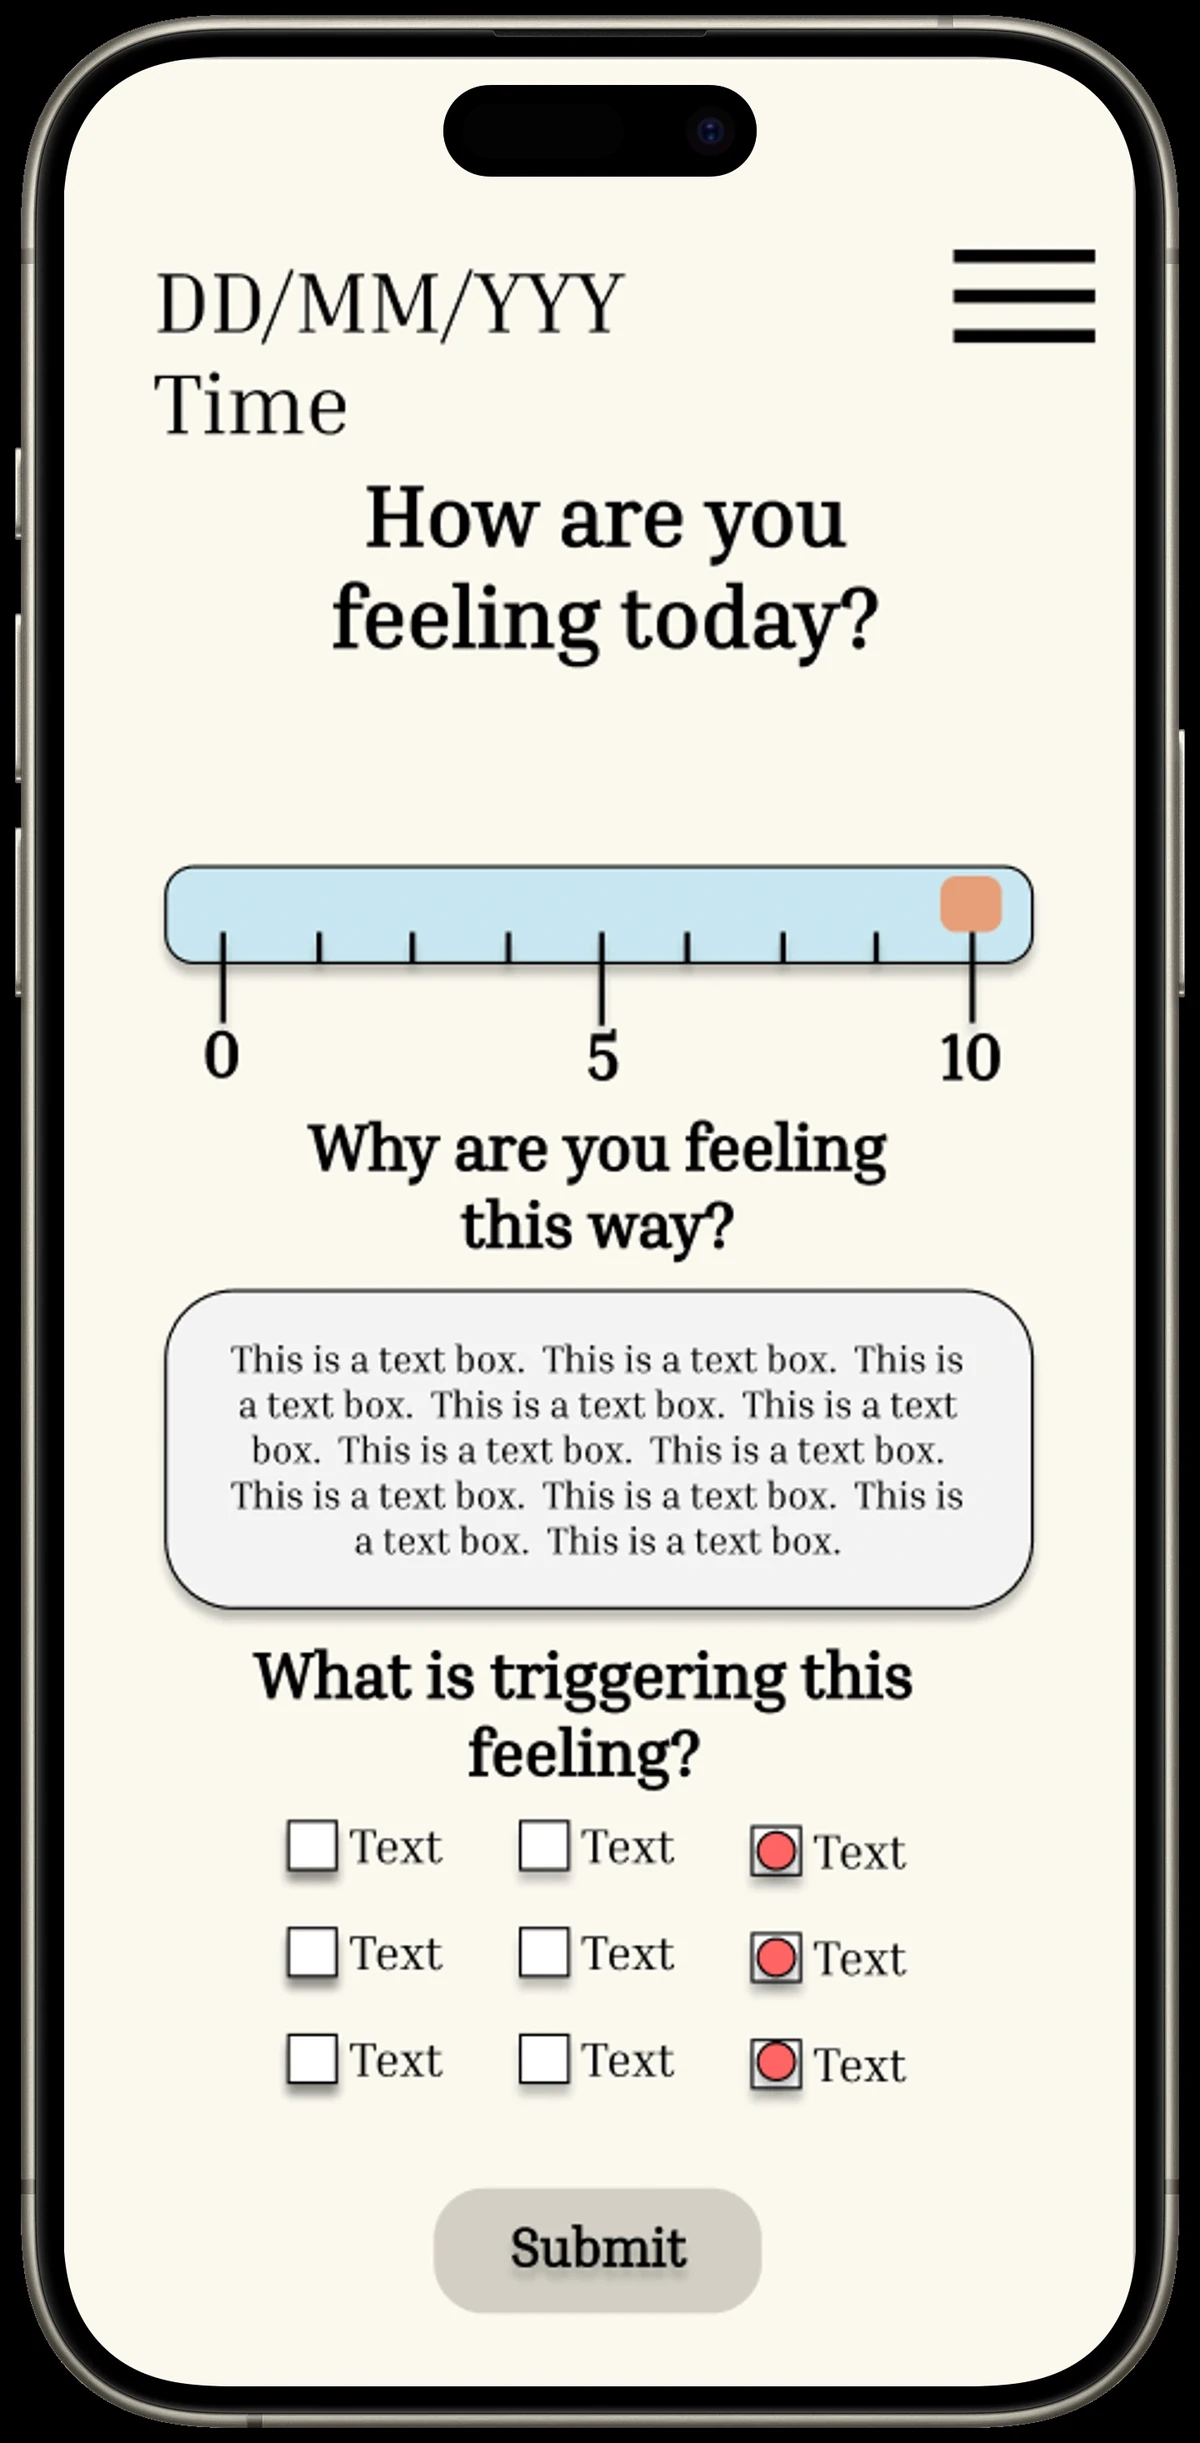
Home screenDaily check-insMood average and trends
05 / Case study
Outcomes
A calmer Insights experience where users can spot trends, compare time ranges, and receive gentle support when stress patterns repeat.